Measuring ROI on AI Operations Investments in Asset-Heavy Industries
Establish operational baselines before deploying AI to prove returns actually happened.

Measuring ROI on AI operations investments in asset-heavy industries starts with a process audit before deployment. Before introducing AI in construction or logistics, organizations need to document how work actually moves, where handoffs fail, and what cycle times and error rates are today. Without that baseline, a return figure is an unverified claim of improvement.
Why ROI measurement in asset-heavy industries is a process problem, not a technology problem
Industries with the most measurable physical operations are producing some of the least credible AI ROI numbers. Construction, logistics, manufacturing, and retail generate countable outputs, including downtime hours, defect rates, delivery completions, and throughput. The raw material for measurement already exists. Yet organizations often introduce AI before capturing those outputs as a record of how the existing process performs.
Terminal X’s analysis of earnings transcripts and filings across five sectors finds that most pilots launch without predefined success criteria. As a result, even a tool that performs exactly as designed can leave the organization unable to declare success. Technical performance is not proof of operational improvement. An accurate output must change a process outcome, and that outcome needs a prior state against which it can be judged.
The same analysis finds that companies pulling ahead have built three layers, measurement that proves whether AI tasks work, infrastructure that joins tasks into automated workflows, and strategy that keeps the system learning. Most companies never built the first layer. Without it, joining workflows can lead to more activity without showing what that activity is worth. Asset-heavy businesses have an advantage because their physical outputs can anchor that first layer without a separate measurement system, provided those outputs are captured before deployment.
Why manufacturing produces the most credible AI ROI figures, and what makes its measurement model work
Manufacturing often begins with records that other industries still need to assemble. CMMS logs, energy meters, and production records already document downtime, maintenance costs, energy use, defects, and labor hours. The baseline is therefore an operating record. This lets manufacturers trace the connection between how work ran before deployment, what changed, and the result that followed. That connection is the replicable part of the model.
Phosai Labs’ 2026 ROI methodology identifies four metric categories used by the most effective manufacturers, namely financial outcomes, operational leading indicators, model quality, and strategic impact. The methodology reports that organizations that consistently measure all four get higher returns than those that measure financial outcomes alone. Operational indicators provide the earliest useful signal. OEE, cycle time, defect rate, and downtime can change before the financial impact becomes visible, revealing whether the process is improving while the return is still developing.
A mid-size automotive supplier case in the 2026 manufacturing playbook illustrates that sequence across 280 critical assets over 14 months. The supplier reduced unplanned downtime and spare parts inventory, increased maintenance labor productivity, and achieved payback in 11 months on a seven-figure investment. The measurement foundation preceded the model’s training. Failure logs, downtime records, and parts consumption data already existed and had been digitized, allowing the result to be evaluated against documented operating conditions.
However, existing records are not automatically a sound baseline. Wrong sensor placement, insufficient sampling frequency, incompatible protocols, and inconsistent or paper-based failure logs can leave a model training on noise. The return calculation inherits the same weakness. Phosai Labs also flags a timing error that better instrumentation cannot solve. Three months of data can misrepresent a use case with seasonal production patterns, so the baseline window must match the production cycle.
Why construction AI ROI is harder to measure and where the baseline problem is most acute
Construction depends on predictive signals whose value comes from acting weeks earlier. Labor shortfalls, submittal backlogs, procurement gaps, and change order disputes are more useful to identify before they become claims. But an early warning needs a reliable reference. Before deployment, the organization must record actual labor productivity rates, submittal cycle times, and procurement lead times so it can judge whether the signal shows a real change from how work normally runs.
A project schedule does not supply that evidence. P6 schedules and similar planning tools capture intent. The evidence of actual risk sits in procurement data, coordination records, and commissioning logs, which most project environments do not capture systematically. Construction therefore generates information that AI needs without consistently preserving it in a form suitable for measurement.
Vision-based progress monitoring makes this distinction particularly clear. A system can autonomously track completed work and compare it with the planned schedule, producing a continuously updated deviation signal. Yet a precise comparison can still be misleading. Its meaning depends on whether the schedule reflects realistically achievable production rates.
AI tools can forecast material needs, flag price volatility, and catch mismatches between purchase orders, deliveries, and invoices. To establish their return, however, the previous process must have a documented error rate, lead time variance, and invoice leakage rate. Otherwise, detected mismatches show that the tool is active, but not how much it improved procurement. Process documentation supplies the denominator that the deployment itself cannot reconstruct reliably.
How the same baseline failure plays out differently in logistics and retail
Route, warehouse, and supply chain systems produce large amounts of data, but legacy TMS and WMS systems keep those records within separate parts of the operation. Locus.sh states that TMS and WMS systems “were never designed to make decisions together”. The difficulty is assembling a coherent prior state. Records can exist throughout the operation without forming a baseline for the workflow that AI is supposed to improve.
That fragmentation also obscures the economics of shared infrastructure. The data infrastructure built for route optimization can also be used for demand sensing, emissions calculation, and predictive maintenance. If each use case is measured in isolation, the combined portfolio return is systematically understated. The measurement boundary is too narrow.
AI investment has favored supply chain, pricing, and e-commerce, where structured data exists, while the store floor has been funded least and measured least. A retailer may therefore measure supply chain AI carefully yet have no baseline for how work runs on the store floor. Total investment figures hide a bias toward measuring where it is easiest to do so, even when the greatest impact may be elsewhere.
In both industries, process outcomes give stronger evidence than measures of how much people use the technology. Cycle time, error rate, throughput, and fulfillment accuracy describe what work achieved, while user counts and platform sessions describe technology use. The distinction changes the interpretation of a deployment. Greater adoption can coexist with unresolved process failures, whereas an outcome baseline makes those failures visible.
What silent failure looks like when AI acts on a missing or bad baseline
When organizations skip the baseline step, the operational risk is not limited to visibly wrong outputs. A system can produce plausible outputs that a team has no reference state to evaluate. Plausibility can then substitute for evidence of correctness. The same omission that weakens the ROI calculation also weakens the organization’s ability to recognize an action that does not fit the process.
This becomes consequential when an agent places procurement orders or reallocates crews. With incomplete, inconsistent, or stale data, an agent may infer the most plausible course from what it has and act without stopping for an error. The action can appear reasonable in isolation. Without a record of how the process runs, reviewers cannot easily tell whether a decision is justified or based on an inference made with missing information.
Human approval does not automatically close that gap. Rubber-stamp drift occurs when reviewers approve outputs so quickly that the review becomes a formality, particularly when they lack a baseline for recognizing anomalies. Governance can then swing between excessive restriction and excessive trust. The former slows delivery and encourages shadow development, while the latter increases operational, security, and compliance risk. A process baseline helps evaluate what the agent actually did against what the process required.
An audit trail provides the record needed for that comparison. It is also the primary instrument for separating AI performance from seasonal variation or process drift, but it cannot interpret itself. Only comparison with a documented baseline turns that history into evidence about operational value.
What should a process audit establish before AI deployment in construction and logistics?
A process audit establishes how work actually runs today. It documents real cycle times, error rates, and handoff failures from field evidence and operational records, rather than treating a procedure document or project schedule as the current state. This is the practical starting point for finding broken workflows before rollout. In construction, the evidence shows actual productivity, the timing of submittals, and how well procurement works. In logistics, it includes the route, warehouse, and supply chain records needed to assemble an end-to-end baseline.
The audit also exposes processes that are not standardized. Deploying an agent into such a process is a common enterprise AI anti-pattern because a workflow that cannot be clearly described cannot be executed reliably through automation. Standardization must therefore precede automation. The audit establishes where the documented procedure differs from operational practice and where the process needs definition before an agent takes responsibility for it.
The resulting baseline must describe more than average output volume. It establishes whether eligible cases enter the existing path and records acceptance, correction, rejection, and exception rates by case type. It also captures completed business states, rework rates, queue age, and fallback use. These measures distinguish activity from dependable completion. After deployment, they provide the reference for judging whether the new path handles the right work, produces acceptable results, and finishes the process better.
Choose the first process based on evidence. Start with a painful workflow whose current-state data is available, whose failure mode is clear, and whose baseline can be established quickly. Phosai Labs requires that baseline to be set before deployment and measurement checkpoints to match when the use case is expected to deliver value. A predictive maintenance timetable cannot simply be transferred to procurement. The audit consequently defines both what will be measured and when an improvement can reasonably be evaluated.
How to structure ROI measurement once a baseline exists
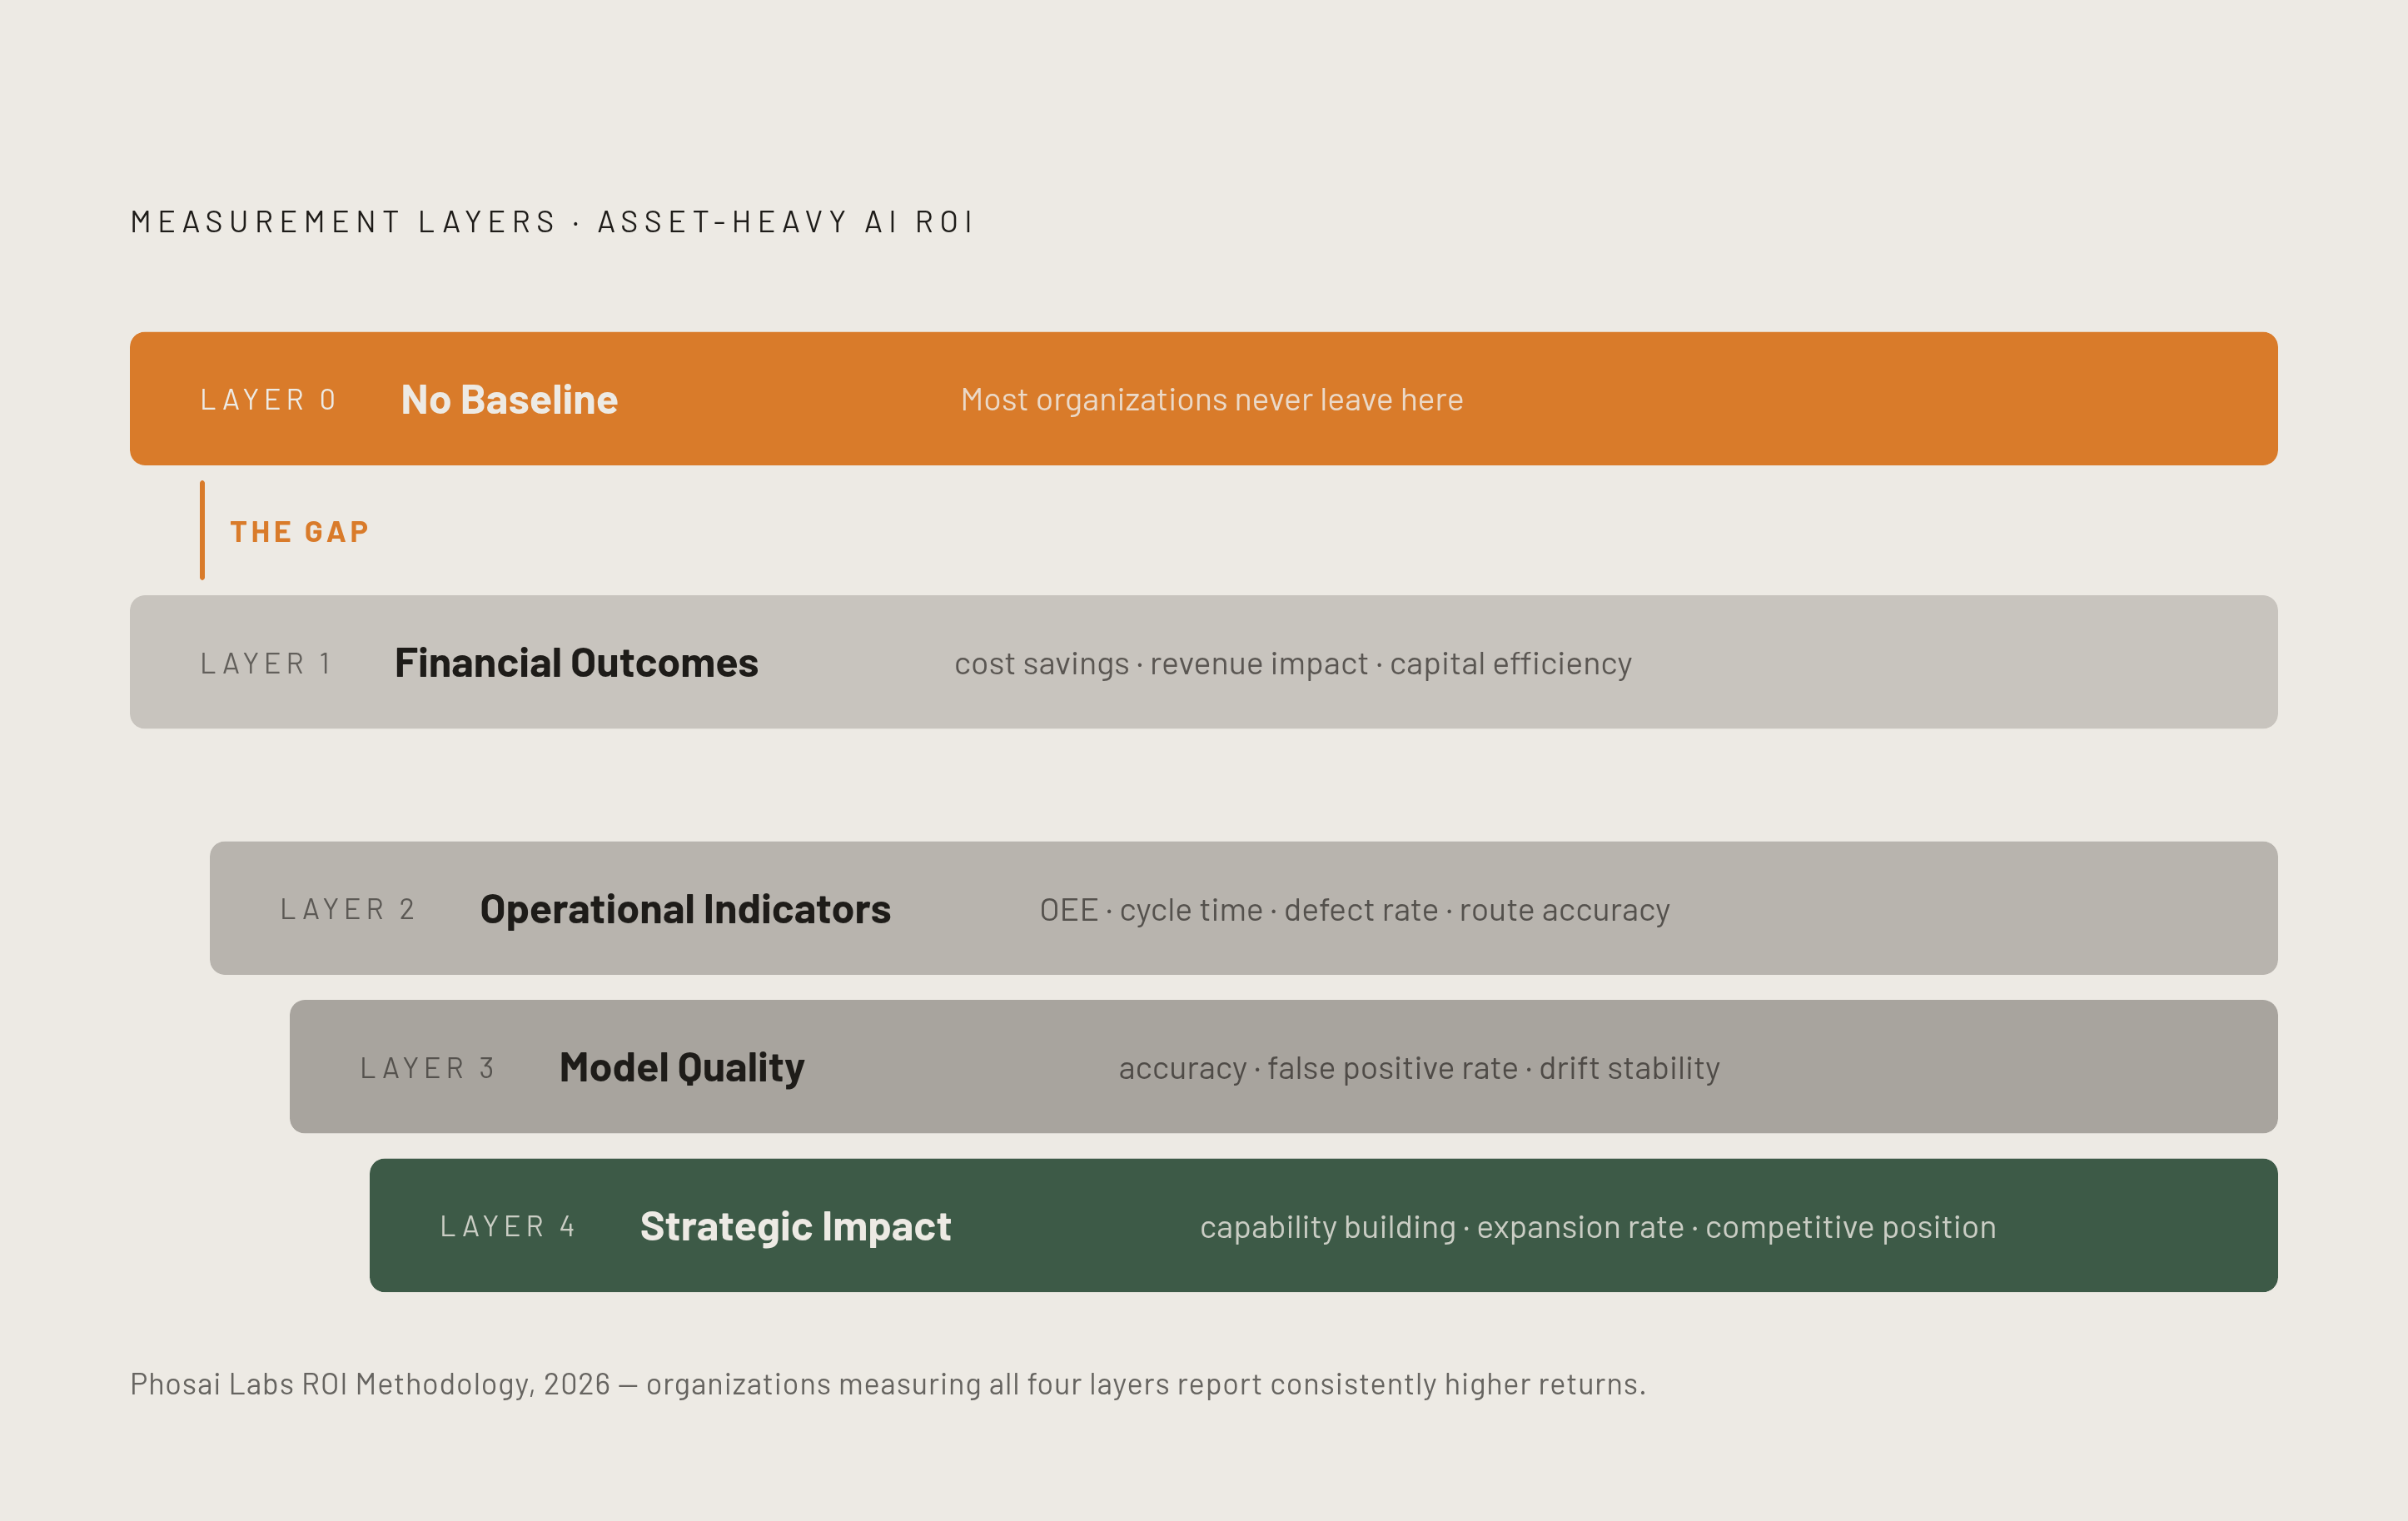
Once there is a baseline, asset-heavy industries can use the same measurement framework. It covers financial outcomes, operational leading indicators, model quality, and strategic impact. These categories answer different questions about the same investment. Financial measures, including cost savings, revenue impact, and capital efficiency, provide the board-level result, but they are lagging indicators. They cannot alone reveal whether the operating conditions supporting that result are deteriorating.
Operational indicators supply that earlier warning. Manufacturing uses OEE, throughput, and defect rate, while construction uses submittal cycle times, procurement lead time variance, and schedule deviation rates. In logistics, the measures are route completion accuracy and fulfillment cycle time. In retail, they are store-floor throughput and out-of-stock rates. Though the measures differ, each shows whether the process is getting better before the financial result can be seen.
Model quality then tests whether the technology remains dependable. Accuracy, false positive rate, and drift stability can reveal degradation after deployment, before its financial consequences appear. In predictive maintenance and procurement forecasting, operational consequences can arrive first. Strategic measures use capability building rate, expansion rate, and competitive position to look beyond the first gain in efficiency. They test whether the investment supports durable improvement or only a one-time result that competitors can replicate.
Terminal X finds that companies with this measurement layer are already seeing the difference priced into their cost of capital. The advantage extends beyond internal reporting. An early baseline gives a sound basis for judging the first workflow, while connected infrastructure allows more uses and supports a strategy that keeps the system learning. As those layers develop together, the organization gains more than isolated savings. It builds an operating foundation that later deployments can use, making the advantage progressively harder to catch up to.